The wealth of a nation
 Peter Cheney analyses the long view in the Central Statistics Office’s national accounts figures.
Mixed economic news emerged when preliminary gross domestic product (GDP) and gross national product (GNP) figures for 2011 were published in March. However, a longer term perspective on both figures shows that most parts of the Irish economy are only going back to the position that they held six or seven years ago.
Both indicators are measured by using constant market prices. GDP and GNP constantly grew year-on-year from 1983, when Ireland was recovering from another recession. From a starting point of €50.4 billion that year, GDP reached €64.7 billion in 1990 and €80.8 billion five years later. GNP, meanwhile, rose from €51.2 million in 1983, to €61.2 million in 1990 and €75.7 million in 1995.
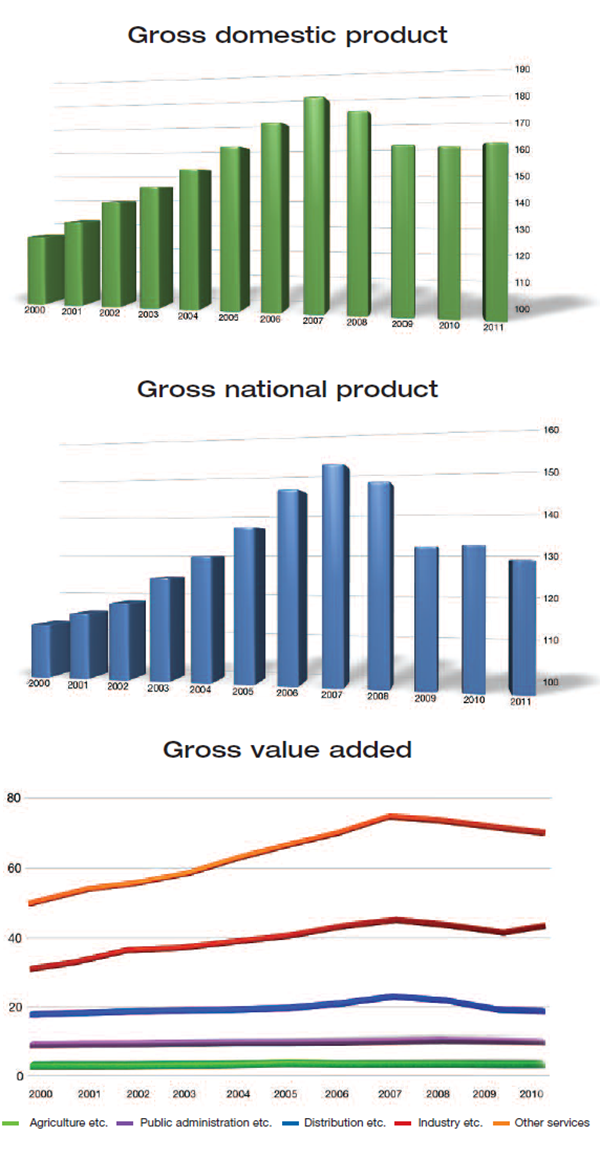
GDP then fell by 10.1 per cent in three years (2007-2010), bringing serious consequences for households, businesses and the finances of the State. However, it was far from a catastrophic blow. It is now essentially at the same level as it was in 2005.
After a 0.7 per cent increase from 2010, the provisional GDP figure for 2011 stands at €161.0 billion. It could, obviously, fall again but for now, appears to have steadied after its steep fall.
When inward investment is excluded, to give the gross national product (GNP), the picture becomes more uncertain. GNP grew faster than GDP at the height of the boom, as personal and indigenous business spending took off. That was followed by a sudden drop of 9.8 per cent in 2008-2009, from which the domestic economy has not yet truly recovered.
A tentative rise in GNP from €132.2 billion to €132.6 billion came before a 2.5 per cent dip to €129.2 billion for 2011, with no sign of optimism.
GDP is calculated by taking the gross value added (GVA) of the economy (i.e. the contribution of each sector) and then adding taxes on products and deleting subsidies on products.
GVA is officially broken down into five sectors: agriculture, forestry and fishing; industry; distribution, transport and communication; public administration and defence; and other services (including rent).
Building and construction is counted as a sub-set of industry and, as expected, has seen the most spectacular fall. After peaking at €9.13 billion in 2007, it lost 58.9 per cent of its value, dropping to €3.75 billion last year. This essentially brings the sub-sector back to 1995 levels, when it generated €3.69 billion. At the height of the boom, construction made up a fifth of all industrial output but that share is now 8.2 per cent. Overall GVA for industry only dipped slightly in the recession, from €45.4 billion in 2007 to €42.2 billion two years later. It picked up to reach a new high of €45.6 billion in 2011.
Agriculture, forestry and fishing has fluctuated around the €3 billion mark since 2004. Its value had previously peaked at €3.46 billion in 1992 and rose again to €3.28 billion in 2005. The 2011 figure (€3.09 billion) is the latest step in a steady recovery, on the back of growing overseas demand and high food prices.
Distribution, transport and communication has declined from €25.1 billion in 2007 to €20.9 billion in 2011, a clear reflection of falling demand in the economy.
Public administration and defence peaked at €6.2 billion in 2008 and now stands at €5.6 billion after cuts of around €200 million per annum. This brings the value of the public sector down to 2006 levels, although further decreases are inevitable.
The Celtic Tiger boosted the value of private sector services by €30 billion between 1998 and 2007, reaching a high of €73.4 billion. Consecutive decreases, reflecting low business and householder confidence, brought that down to €67.6 billion last year, again back to 2006 levels.
National accounts, of course, do not give the full picture as they do not clearly factor in the hardship caused by levies, debt and rising fuel prices, or account for the general well-being of a nation. As Robert Kennedy famously said, GNP “measures everything in short, except that which makes life worthwhile”. What the figures do show, though, is that Ireland has not completely fallen from its economic heights and, compared to past generations and many other countries, can still consider itself prosperous.
All graph figures in € billion 2011 figures are preliminary


