Provisional census trends
 The provisional figures for Census 2011, revealing the highest population in 150 years, could have big implications for the future. Stephen Dineen reports.
In July the provisional figures for the 2011 Census were published, less than three months after census night. Figures were released on the number of people at electoral division, county and regional level, as well as the number of births, deaths and migration levels for the same areas over a five year period.
With an increase of 8.1 per cent since 2006, Ireland now has a population of 4,581,269. This represents an increase of 17 per cent in nine years, and shows a population with a far higher birth rate than most European countries.
Whilst we will have to wait until next year for figures on issues like age, occupation and marital status, the provisional details give us an insight into certain features of modern Ireland and their possible implications for the decades ahead.
Population trends
There are two components to population change: natural increase (the number of births minus the number of deaths) and net migration (the number of people migrating into an area minus the number migrating out of an area). In terms of natural population increase Ireland has experienced a sharp increase in the number of births and a decline in the
number of deaths. Over the past five years an average of 73,000 people were born every year, whilst 28,000 people died. Not since the 1979-1981 period has there been such a high birth rate, whilst the number of deaths has never been lower in the history of the state. To put the birth rate figures in context: Eurostat figures for 2008 show an EU crude birth rate average of 10.9 per 1,000 people; Ireland’s was 16.9. The natural change in population in the EU in 2008 was 1.2 persons per 1,000; in Ireland it was 10.4.
The picture of net migration is more nuanced. We know that net inward migration was quite high for the early years of the intercensal period, but this has changed. During the 2006-2011 period there was net inward migration of 23,730 people per annum, compared to 47,832 between 2002 and 2006. The CSO estimates that there was net outward migration of 34,500 from April 2009 to 2010, but it appears that emigration has not been as high as predicted.
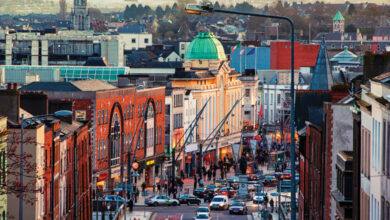
The provisional figures show us what parts of the country are experiencing population increases. In 2002 the large increases were in the commuter belt around Dublin. In 2011 the big increases were in a widened Dublin commuter belt (including the midlands) and the hinterlands of cities. Laois was a headline at the time of the figures’ release, showing a 20 per cent increase in population since the last census. Other areas to show large increases were those with new housing and young families such as Fingal, Kildare, Meath and Longford, whilst the cities saw minimal increases in population (decreases in Limerick and Cork city) and outward migration.
Planning
These figures will be vital for how the state plans its future provision of services and funding. Where the resources in areas like health, education and transport go will be determined to a large extent by where the population is.
In the area of education, for example, we know that the Department of Education had 57,837 Leaving Certificate candidates in 2010 (a drop of 9 per cent on 2000) but that, on average, 73,000 were born per annum over the last five years. This does not mean 73,000 will sit the Leaving Cert in 18 years time, but Leaving Cert retention rates and data such as a breakdown in the type of Leaving Cert students suggest demands on the education system are likely to increase.
Another area of possible policy implications is social protection payments. Child-related payments accounted for 12.7 per cent of the Department of Social Protection’s expenditure last year (€2.2 billion on child benefit), compared to 22.1 per cent of it on older people. An increasing number of children in the population may prompt changes to the proportion of spending on child-related payments or rates of payment.
Planning may be needed, but its success is not guaranteed. “Without a National Spatial Strategy, three quarters of the country’s projected population increase of half a million, or possibly significantly higher than that, over the next twenty years is likely to happen in or near the Greater Dublin area, making congestion even more difficult to deal with.” This statement was contained in the National Spatial Strategy 2002-2020. Since it was published the population has already increased by 664,000, with 40 per cent of it in Dublin or the Mid-East (Dublin’s commuter belt).
The strategy outlined nine gateways (the five cities plus four new gateways: Letterkenny, Dundalk, Sligo, Athlone- Tullamore-Mullingar), and nine hub towns to support the gateways and link out to rural wider areas, yet a look at the census figures in 2011 and 2006 reveal surges in population in non-gateway areas.
Housing
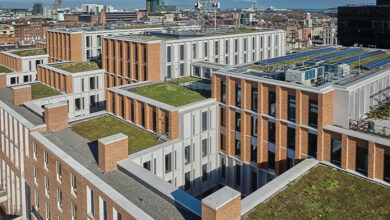
Another area of note in the provisional figures is the number of vacant houses. Though there was an 8.1 per cent increase in population there was a 13.3 per cent increase in the number of dwellings. The biggest increases were in Laois (21.2 per cent), Donegal (20 per cent), Leitrim (19 per cent), and Longford (19 per cent), most of which do not have gateways. 14.7 per cent of housing stock is vacant. Whilst this figure includes holiday homes (a figure for how many holiday homes will be published next year) the past five years saw an increase of 10.5 per cent in the number of vacant dwellings at a time of an 8.1 per cent population increase. Over one in five dwellings are vacant in ten different counties.
The possible implications of where the population increases have occurred, and where the vacant housing exists, are of continuing urban sprawl and commuter lifestyles for a considerable number of workers, whilst the high rate of vacant housing stock (37 per cent of which is in Dublin and the rest of Leinster, though this area currently has 55 per cent of the population) should determine either where future population increases will occur or the short to medium term policy to deal with these vacant houses.
Political representation
There is also a political implication from the provisional census figures. The Government is committed to reducing the number of TDs, and following the publication of figures in July the Minister for the Environment changed the terms of reference for the electoral boundary commission to reduce the number of Dáil deputies by between six and 13. Constitutionally a constituency needs to have representation of one TD per 20-30,000 people. The provisional figures show a current average of 27,598 people per TD.
Commuter belt constituencies like Kildare North, Kildare South and Laois-Offaly and several others are either very close to or over the 30,000 threshold. Parts of Dublin and much of Connaught-Ulster show stronger levels of representation. These areas may well be the first to see a reduction in the number of TDs or a re- drawing of boundaries.
The definitive results of the census are due next March. They will reveal a breakdown of figures concerning a range of socio-economic characteristics, which will further help state agencies and others plan for the years ahead.
Census 2011 in figures
4,581,269: Ireland’s population
8.1 per cent: the increase since 2006
(17 per cent since 2002)
20 per cent: Laois’s population increase since 2006 (the largest percentage increase
in Ireland)
73,000: the average number of births per annum 2006-2011
28,000: the average number of deaths per annum 2006-2011
23,730: estimated net inward migration per annum 2006-2011
2,004,175: the total number of dwellings
294,202: the number of vacant dwellings
27,598: the current average number of people per TD