Cork’s smart city dashboard


As we progress further into the 21st century, Cork continues to modernise and adapt in the current age of innovation. With that progress has come an exponential increase in data creation, leading to the emergence of ‘city dashboards’. Cork is the latest city to avail of the platform.
As a city grows, so too does its generation of large volumes of often complex data. Collecting and monitoring this massive portion of data presents an enormous challenge to not only public-sector officials, but also the citizens and businesses of Ireland who are reliant on up-to-date information and time-series indicator data. Now, researchers from the National Centre for Geocomputation in Maynooth University have developed a platform which collates a range of data sources into one user-friendly platform.
The recently-developed Cork Dashboard provides users with real-time information, time-series indicator data and interactive maps surrounding streams of data concerning all aspects of Cork city and county. Pulling data together collates together several sources of data, enabling users to gain detailed and updated information about the city – enabling policy creators and decision makers to provide accessible, evidence-informed analysis.
The initiative promotes the release of data, previously managed by governmental departments and agencies into the public domain. The easy-access of local authority data portals has led to the improved availability of administrative and real-time data – which has, in turn, encouraged the creation of city dashboards across the world. Using a range of static and real-time interactive data visualisations, including graphs, photos, videos, gauges and 3D models, smart city dashboards can effectively communicate how efficiently a city is operating.
The intuitive platform, free to use, offers a simple method of organising complex city datasets, including a series of administrative data sets that can measure, monitor and evaluate key urban indicators such as house prices, weather, air quality, public transport and unemployment. By collating and organising data sources in this way, developers have provided users in Ireland with the tools to provide intra/inter-city comparisons for the first time.
Researchers at Maynooth University suggest that such dashboards should be regarded as a key element of any modernised, ‘smart’ city. For complex decisions to be made surrounding public policy and infrastructural investment, decision makers must have access to live, up-to-date intelligence about their urban environment that is extracted from interlinked and complex city datasets.
The launch of the Cork Dashboard comes three years after the successful launch of the Dublin Dashboard, which was developed in 2014 by Researchers from the Programmable City project in Maynooth University, working in conjunction with Dublin City Council. The Cork Dashboard, developed by the Building Society Dashboards and the All Island Research Observatory at Maynooth University in collaboration with Cork Smart Gateway, similarly to the Dublin model, offers users a range of important functions.
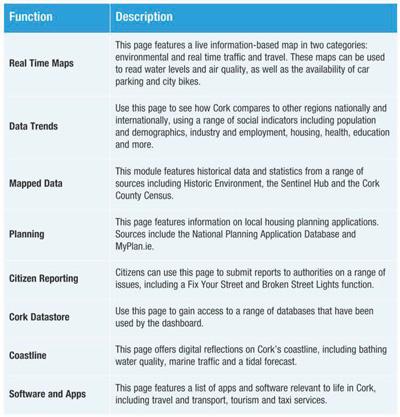
Of particular value are the real-time maps included as part of the Cork Dashboard. An environmental module provides users with live information on metrics such as water level and air quality – a feature which is achieved by the developer’s pulling together of data from sources such as the Environmental Protection Agency (EPA), the Office of Public Works (OPW) and Transport Infrastructure Ireland. Similarly, real-time traffic and travel information, including the availability of car parking and city bikes is available via the Cork Dashboards’ intuitive, real-time traffic and travel map.
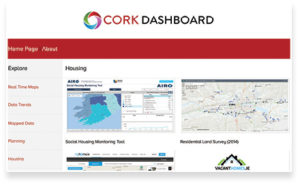
Central to the Cork Dashboard is its ability to articulate data trends across the city and county. Using a range of social and economic indicators, including population and demographic information, industry and employment data, housing indicators, environmental indicators, health and education indicators and crime and emergency services indicators, developers have provided users with a means of exploring and interpreting vast, complicated streams of data collated over a period of years. The representation of such indicators, combined with reports on public sector spending, living costs and planning sites across the city equip policy makers with the tools to make information and evidence-based decisions.
Integrated into the Cork Dashboard is a function whereby citizens can submit reports to local authorities, with platforms such as Cork City Now Community Messaging Service, Cork City Council Online Citizen Consultation Portal, Fix Your Street and Broken Street Lights united and displayed on one site.
The recently-established Building City Dashboards (BCD) project determines how to build more extensive and comprehensive city dashboards, developing new tools that can provide decision support frameworks that can be used by academics, public officials and citizens alike in an unprecedented way.