A new era of independent policing oversight
The Policing and Community Safety Authority (PCSA), formally established on 2 April 2025, marks a new chapter in independent oversight of An Garda Síochána.
The Authority brings together the functions of the former Policing Authority and the Garda Síochána Inspectorate, with strengthened inspection powers and an enhanced role in community safety.
At its core, the PCSA exists to independently and transparently oversee and assess the performance of An Garda Síochána in providing policing services to communities across Ireland. Our work builds on the legacy of our predecessor organisations; the Policing Authority and the Garda Síochána Inspectorate and places the public interest at the centre of everything we do.
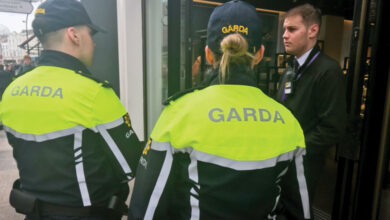
Gardaí hold significant powers to use force, to search homes and to restrict our liberty. These powers must always be used legally, fairly and proportionately. Robust supervision, management and oversight from inside the policing organisation is one element of the checks and balances that seek to ensure the appropriate use of policing powers. Independent civilian oversight, provided by the PCSA, is another essential check that ensures policing powers are exercised in a way that serves all communities, respects the law and upholds human rights.
We give effect to this oversight through continuous engagement, with communities, with garda members, and garda management. This includes monthly meetings with the Garda Commissioner, held both in public and private.
We listen to the experiences of people in the community in all its diversity. We listen to gardaí who are delivering the policing service. And we listen to and challenge those in garda management on the performance of the service.
“We are committed to ensuring that Ireland’s policing service operates with transparency, accountability, and the confidence of the people it serves.”
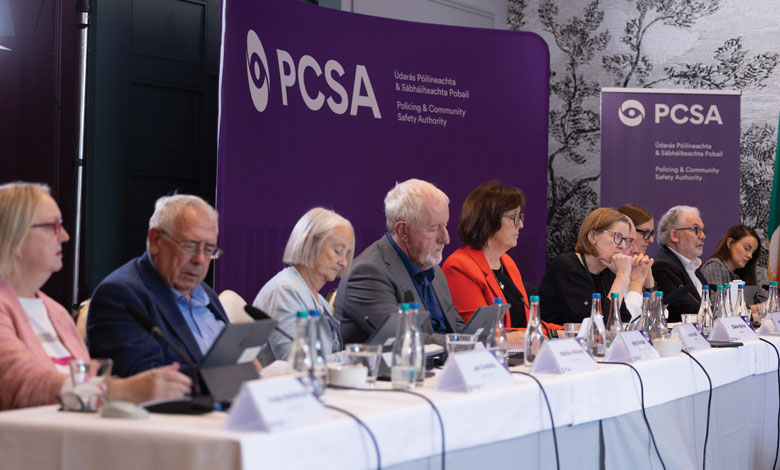
An integral part of the Authority’s remit is meeting with the Garda Commissioner and senior officers in person almost every month, both in public and private. The meetings held in public are live-streamed and recorded. The agendas and minutes of all the meetings are published on our website. A cursory glance at the agendas of our first six meetings, three of which were in public, gives an indication of the breadth of our work.
Community safety
Keeping communities safe is about more than policing. It requires a collaborative approach involving mental health services, housing, youth services, local authorities, and education; all involved in multi-agency cooperation. The inclusion of community safety in our name and mandate is an exciting development. It recognises that safety is complex, personal, and our sense of being and feeling safe can change through our life.
We work closely with other agencies through the National Community Safety Steering Group and the recently established National Office for Community Safety, sharing information and insights to help shape this new dimension of our role.
A busy first few months
In April 2025, we began developing the 2026-2028 Policing Priorities by engaging directly with communities and garda personnel around the country. We wanted to find out what areas of policing are most important for gardaí to focus on. Four in-person regional events brought together around 100 community stakeholder groups. A public online consultation received 3,794 responses and our staff met more than 400 serving gardai from every county.
These new Policing Priorities, currently with the Minister for approval, will form a cornerstone of our future oversight work. They are the benchmark against which we will assess garda performance, reflecting the voices of both those who deliver and those who receive the policing service.
At our July 2025 Authority meeting in public, the Authority discussed the Crowe Report, which revealed serious shortcomings in roads policing performance, revealing how a significant minority of gardaí are not doing their jobs properly and have no interest in doing so. It highlighted wider issues of performance management. We continue to engage closely with the Garda Commissioner on how these findings are being addressed, both immediately and at a strategic level.
At our most recent meeting in public in September 2025, the new Garda Commissioner, Justin Kelly, outlined his vision and ambition for An Garda Síochána and was questioned on key policing priority items. Each month, the Garda Commissioner also submits a detailed report to the Authority – published for transparency – and it contains important information on the use of force, garda strength, information on suspensions and the key focus of the organisation. The PCSA does not have a role in individual complaints made against gardaí; this is the remit of Fiosrú, the new statutory body replacing the Garda Síochána Ombudsman Commission (GSOC), which deals with complaints from members of the public about the gardaí.
Inspections and oversight in practice
The PCSA now has the power to conduct announced and unannounced inspections at garda stations and facilities. A key milestone this year was the signing of the Memorandum of Understanding between the PCSA and An Garda Síochána setting out the framework of inspections. These inspections, and the reports arising from them, will be published and will play a central role in shaping our future oversight. Work is already under way on our Inspection Plan 2026.
We are also finalising our Strategic Plan 2026-2028, developed following extensive consultation. It is ambitious but achievable, focused on improving both the policing service the public receives and the working environment for those who deliver it.
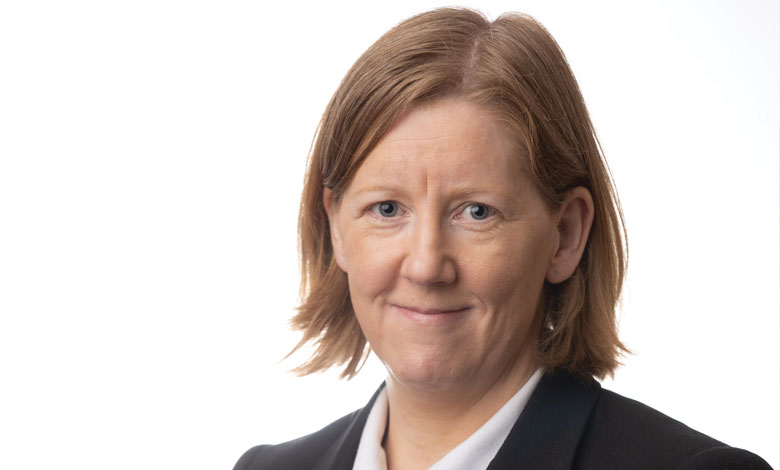
As required by legislation, the Authority’s members bring collective expertise across human rights, social services, the justice system, data and services for victims. As a practising barrister, my own work has brought me into contact with people from all walks of life, deepening my understanding of community and fairness in public service. The Authority is supported by a dedicated executive team under the leadership of the Chief Executive Helen Hall. Together, we are committed to ensuring that Ireland’s policing service operates with transparency, accountability, and the confidence of the people it serves.
Elaine Byrne BL is Chairperson of the Policing and Community Safety Authority.
W: www.pcsaireland.ie
YouTube: www.youtube.com/@PCSA_Ireland
X: www.x.com/PCSA_Ire
Instagram: pcsa_ireland
LinkedIn: www.linkedin.com/company/policing-and-community-safety-authority/